Broward County Analysis
In Broward County, an EARTH ECONOMICS study found that urban heat islands increase maximum temperatures by as much as 5°F above the local baseline. 90,000 people live in neighborhoods where the urban heat islands increase temperatures by 2°F or more and where average per capita incomes are less than 200% the federal poverty level (outlined in black in map, below). 33,000 people live in areas that meet the above criteria and have a high percentage of population in high risk age groups (under age 14 or over age 65). Every additional degree carries significant public health costs.
In the Broward County's most severe urban heat islands, all-cause mortality rates are estimated to increase by 4.7% (2.4% - 7%) when baseline temperatures exceed 90°. Broward County experience 74 days above 88°F per year, on average. Our model estimates that 13 - 44 lives are lost in the county each year due to urban heat islands effect.

*High Risk Area is defined as neighborhoods where the urban heat islands increase temperatures by 2°F or more and where average per capita incomes are less than 200% the federal poverty level.
**Highest Risk Area is defined as neighborhoods where High Risk Area criteria is met as well as a high percentage of population in high risk age groups (under age 14 or over age 65)
The cost of public health casuses the greatest economic burden on low-income communities.
The public health burden of urban heat islands is disproportionately levied on the lowest income households. In Broward County there is a strong correlation between household income and urban heat islands (Table 1, below).
TABLE 1: Income per Household

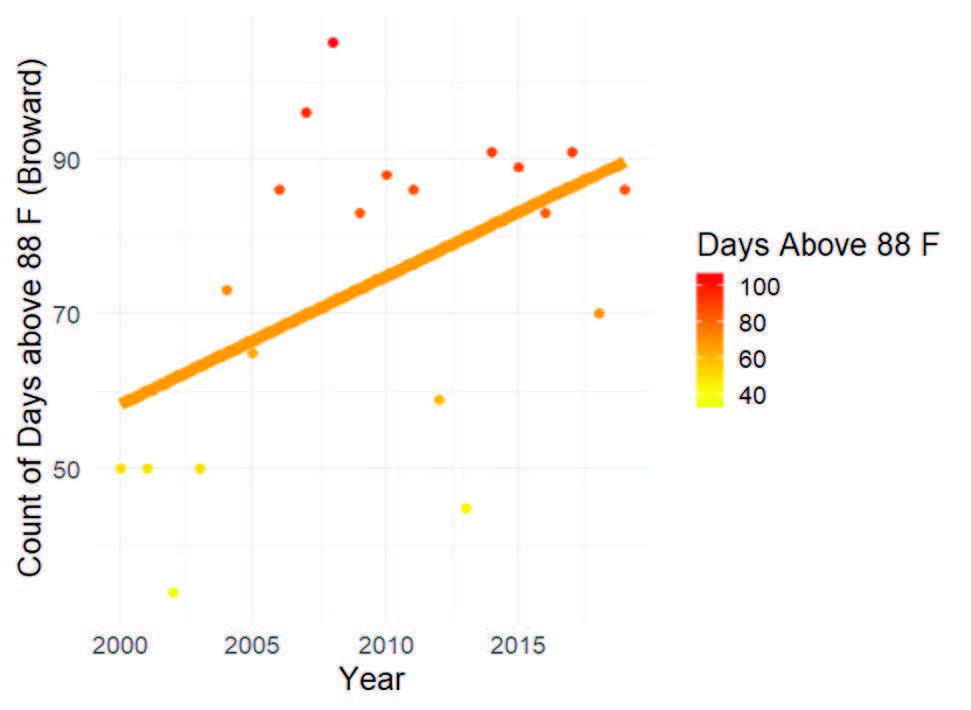
Temparatures in Broward County have increased 36% in the last 20 years.
Without intervention, Broward County's heat island impacts will grow significantly in a changing climate. Number of days above the 88°F threshold has increased by 36% since 2000. On the current trajectory Broward County will experience 144 days above the temperature threshold by 2050, and 223 days above the threshold by 2100.
TABLE 2: Number of Days Above 88°F